
The Sunday Drive - 11/23/2025 Edition [#190]
Musings and Meanderings of a Financial Provocateur

👋🏼 Hello friends! Let’s enjoy a leisurely Sunday Drive around the internet.

🎶 Vibin'
After the market close on Wednesday 11/19, arguably the most important company in the world, Nvidia Corporation, filed their Form 10-Q with the SEC which reported their fiscal Q3 earnings. On Thursday 11/20, the stock initially traded higher on the strength of the company’s apparently strong results. However, by the end of the day the stock had closed down.
What happened? It seems that a number of autonomous trading algorithms (ironically) powered by AI, quickly dug into the company’s 78 page 10-Q and seem to have found some troubling accounting items that may be an indication that a few cracks are beginning to appear in the AI growth cycle. We’ll discuss this a bit down below.
This week, I’m vibin’ to the 1982 hit, Abracadabra by the Steve Miller Band.
💭 Quote of the Week
“Hope functions economically like an option: a right, not an obligation, to move up the socio-economic ladder. Its strike price is the cost (in time and money) required to attempt advancement.“
— Michael Green
📈 Chart of the Week
You Are Here 🎯
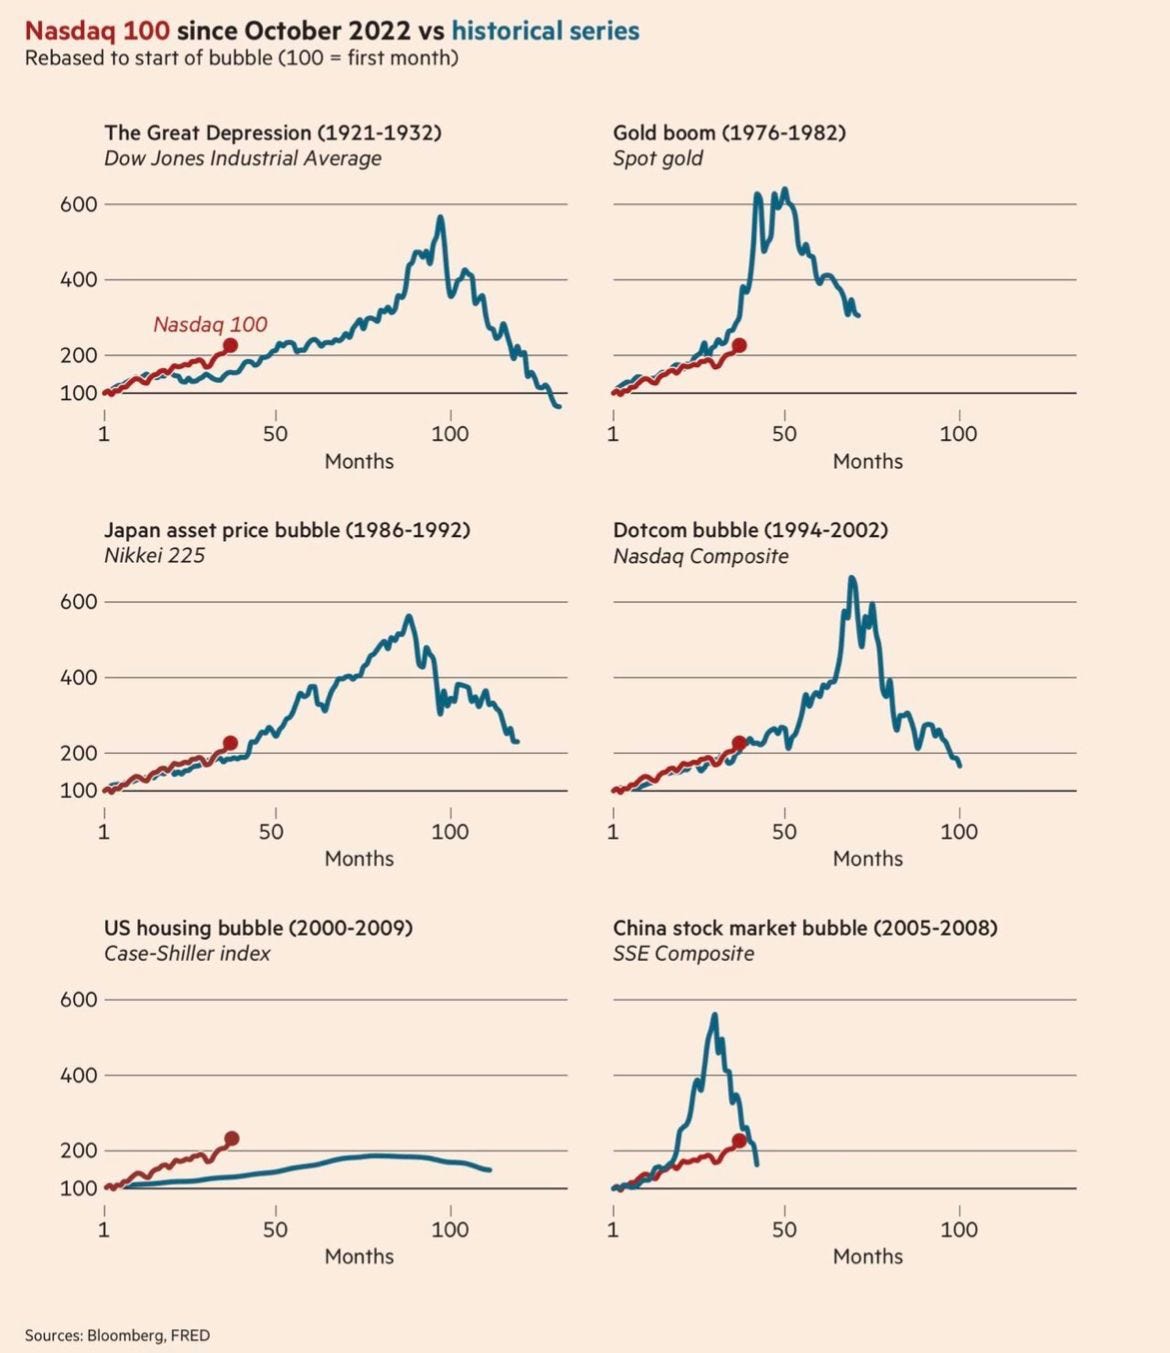
This week’s Chart shows the Nasdaq 100 Index plotted against a number of historical bubbles. When investment bubbles are discussed, it’s common for folks to ask, “Where are we in the cycle?” I find historical comparisons interesting, but not necessarily helpful.
I think that the end of an investment cycle approaches as financial stress begins to show in the results of the players in the ecosystem, and the accounting gets more and more, err…creative.
As mentioned above, NVDA’s recent earnings results seemed fine until investors sunk their teeth into the other financial statements. That where a couple of potentially troubling accounting measures which gave rise to creeping doubts as to the health and durability of the AI buildout.
First, there was a $4.8 billion build in inventories, from $15.0 billion in Q2 to $19.8 billion in Q3. This runs counter to management’s ongoing narrative of demand in excess of supply and manufacturing capacity constraints. In my mind, companies with substantial and growing order backlogs do not build inventories. 🤔
Also, Days Sales Outstanding (DSO) grew for the third consecutive quarter, from 48.2 days in Q1, 50.7 days in Q2, and 53.3 days in Q3. DSO (Accounts Receivable ÷ Revenues × Days in Period) measures the average time it takes to collect the cash from the booking of company revenues. It is a key indicator of the financial health of a company’s customers. Extended collection terms doesn’t inspire confidence in that regard. 🤔
Going back to this week’s Chart, I have no idea “where we are in the cycle”. But given the breakneck speed at which the AI spending cycle has run thus far, I am increasingly inclined to believe that it may well be a good bit shorter than historical comparisons.
Stay vigilant.
Source: Nvidia Corporation SEC filings.
🚙 Interesting Drive-By's 🚙
🤔 The Home Ownership Distraction: It Is Not the Same as Housing
💯 10 Metatrends That Will Define Your Future
🎯 The Age of AI Is Starting to Bloom
⁉️ What’s the Truth Behind These AI Layoffs?
👋🏼 Parting Thought
If you have any cool articles or ideas that might be interesting for future Sunday Drive-by's, please send them along or tweet 'em (X ‘em?) at me.
Please note that the content in The Sunday Drive is intended for informational purposes only, and is in no way intended to be financial, legal, tax, marital, or even cooking advice. Consult your own professionals as needed. The views expressed in The Sunday Drive are mine alone, and are not necessarily the views of Investment Research Partners.
I hope you have a relaxing weekend and a great week ahead. See you next Sunday...
Your faithful financial provocateur,
-Mike
If you enjoy the Sunday Drive, I'd be honored if you'd share it with others.
If this was forwarded to you, please subscribe and join the other geniuses who are reading this newsletter.