The Sunday Drive - 09/28/2025 Edition [#182]
Musings and Meanderings of a Financial Provocateur
👋🏼 Hello friends! Let’s enjoy another leisurely Sunday Drive around the internet.
🎶 Vibin'
No theme this week, just a reminder of the power of love and the memory of one of the most beautiful songs ever written. Please enjoy “How Do You Keep the Music Playing?”, performed live by James Ingram (RIP) and Patti Austin with the Boston Pops.
💭 Quote of the Week
“’I’d rather be someone’s shot of whiskey than everyone’s cup of tea.“
— Stacy Havener
📈 Chart of the Week
Calm Seas Make for Poor Sailors
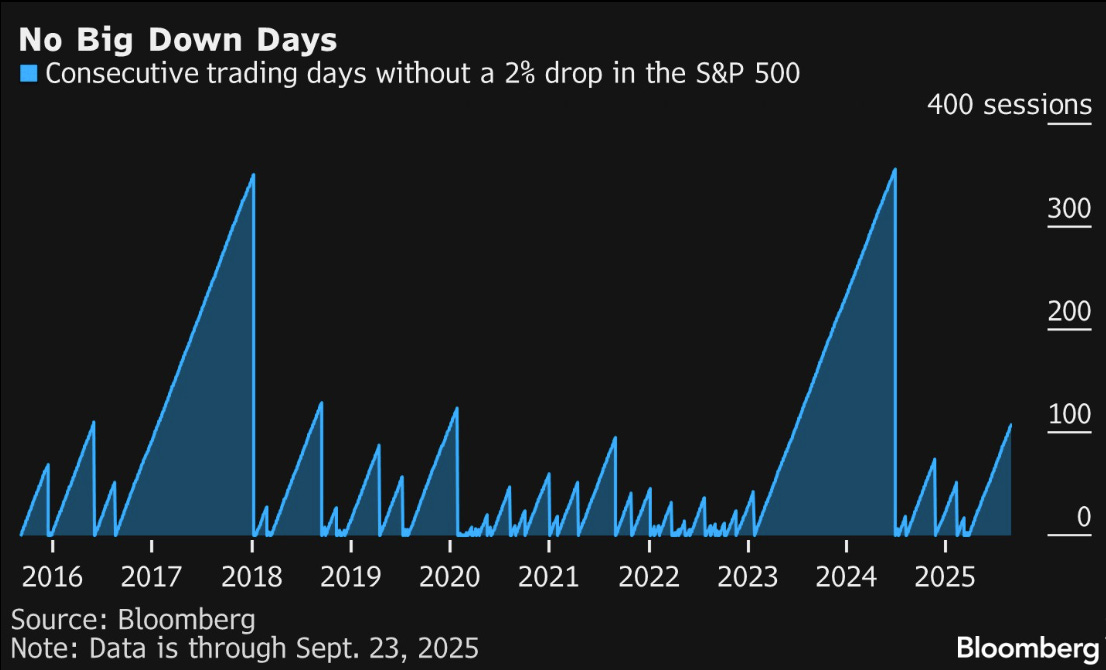
Since the 20% drawdown this past spring, equity markets have had a fairly smooth upward climb, making and then remaining near all time highs. In fact, the Chart of the Week shows that it has now been over 100 trading sessions in which the S&P 500 has not had a day with 2% drawdown.
This is noteworthy but not unprecedented. Over the last decade, there have been two occasions with significantly longer periods of low downside volatility. They’re worth taking a look at.
2017–2018: Complacency and the “Volmageddon” Shock
The first extended stretch in the chart — 2017 through early 2018 — marked one of the calmest equity markets in history. The S&P 500 delivered a smooth upward grind without any 2% daily drawdowns. Implied volatility (VIX) sat at historically low levels, frequently in single digits. This tranquil regime ended abruptly in February 2018 with the so-called “Volmageddon.”
Volmageddon was triggered by a massive short-volatility unwind. Popular exchange-traded products (such as XIV) that profited from selling volatility were forced to buy back VIX futures as volatility spiked, causing a feedback loop that drove the VIX from the low teens to near 50 in a matter of days. This mechanical buying pressure amplified the market selloff, snapping the market out of its low-volatility state and ushering in a more volatile 2018.
At the same time, interest rates were climbing as the Federal Reserve steadily raised its target range from near-zero levels to roughly 2.25–2.50% by the end of 2018. This gradual tightening set the stage for the eventual slowdown later that year.
2023–2025: Quiet Under High Rates
Fast-forward to the present period (2023 onward), with the exception of what I like to call “Tariff-mageddon” in April, the S&P 500 has again entered a remarkably calm stretch. Unlike 2017, this tranquility is taking place in a world of much higher interest rates — the Fed funds target range peaked around 5.25–5.50% in 2023 before modest cuts in late 2024 and just recently earlier this month. Despite this tighter monetary backdrop, implied volatility has remained contained, with the VIX averaging in the mid-teens to low-20s.
This divergence suggests that dealer hedging flows, systematic volatility selling, and resilient corporate earnings have helped keep realized volatility suppressed. Yet, with credit conditions tighter and macro uncertainty elevated, the calm may be more fragile than it appears.
Comparing the Regimes
The 2017–2018 period was characterized by low rates, cheap money, and investor complacency — fertile ground for extended calm. The current stretch is occurring in a more restrictive environment. If a shock were to hit (credit stress, policy misstep, geopolitical risk), the unwind could be sharper given the higher cost of capital and less policy room to ease quickly.
The lesson from Volmageddon is that extended calm can mask systemic vulnerabilities. When volatility finally resurfaces, the break can be sudden and violent — a risk investors should keep in mind should the S&P continues its placid climb.
What to Watch For What Comes Next 👀
Here’s what I’m keeping an eye on to see when, not if, this recent period of tranquility might be nearing its end:
VIX Term Structure: If the front end of the curve inverts (spot VIX trades above 3-month futures), that’s often a sign of near-term stress.
Credit Spreads: High-yield and investment-grade spreads remain tight; any widening could indicate risk aversion creeping back in.
Liquidity Indicators: Measures like the Chicago Fed Financial Conditions Index or cross-asset volatility indices can warn of tightening liquidity.
Fed Policy Path: The pace and depth of 2025 rate cuts will be critical. A slower-than-expected cutting cycle could pressure valuations.
Dealer Gamma Positioning: As option dealer gamma flips negative, markets can become more mechanically volatile.
Periods of calm are nice while they last — but they are never permanent. Keeping an eye on these indicators might help us avoid being caught off guard when volatility inevitably returns.
Sources: St. Louis Federal Reserve, Gateway Investment Advisors, National Association of Insurance Commissioners (NAIC), Bank for International Settlements (BIS)
🚙 Interesting Drive-By's 🚙
🤔 Ready Layer One - The Race to Build Finance-First Blockchain Infrastructure
💸 Intel and the Rise of U.S. Tech Nationalization
💡 From Healthspan to Soulspan™️: The Joy of Aging Out Loud
📈 Quantum: The “Next Big Thing” Explodes
🏠 What If Local Control Can Actually Help Build Housing?
👋🏼 Parting Thought
Feeling those Vermont fall foliage vibes…
If you have any cool articles or ideas that might be interesting for future Sunday Drive-by's, please send them along or tweet 'em (X ‘em?) at me.
Please note that the content in The Sunday Drive is intended for informational purposes only, and is in no way intended to be financial, legal, tax, marital, or even cooking advice. Consult your own professionals as needed. The views expressed in The Sunday Drive are mine alone, and are not necessarily the views of Investment Research Partners.
I hope you have a relaxing weekend and a great week ahead. See you next Sunday...
Your faithful financial provocateur,
-Mike
If you enjoy the Sunday Drive, I'd be honored if you'd share it with others.
If this was forwarded to you, please subscribe and join the other geniuses who are reading this newsletter.


