
The Sunday Drive - 03/08/2026 Edition [#205]
Musings and Meanderings of a Financial Provocateur

👋🏼 Hello friends! Let’s enjoy another Sunday Drive around the internet.

🎶 Vibin'
Given the tensions around the world, and in particular the Middle East, I thought it might be nice to vibe to something that reminds us that love conquers all.
H/T to my daughter for surfacing On My Soul, just released a few days ago by Bruno Mars. I hope you enjoy it because you’ll likely hear it played at every wedding you attend for the next 20 years.
💭 Quote of the Week
“In a world optimized to make everyone hysterical, calm becomes a form of authority.“
— Mariah Faith Continelli
📈 Charts of the Week
History Doesn’t Repeat, But It Rhymes
As I write this week, I fully acknowledge that the situation in the Middle East is very fluid and the shelf life of this piece could be very short. However, given the importance of current events, I thought it was still worth discussing.
This week’s Charts tell a story that feels eerily familiar, and yet fundamentally different.
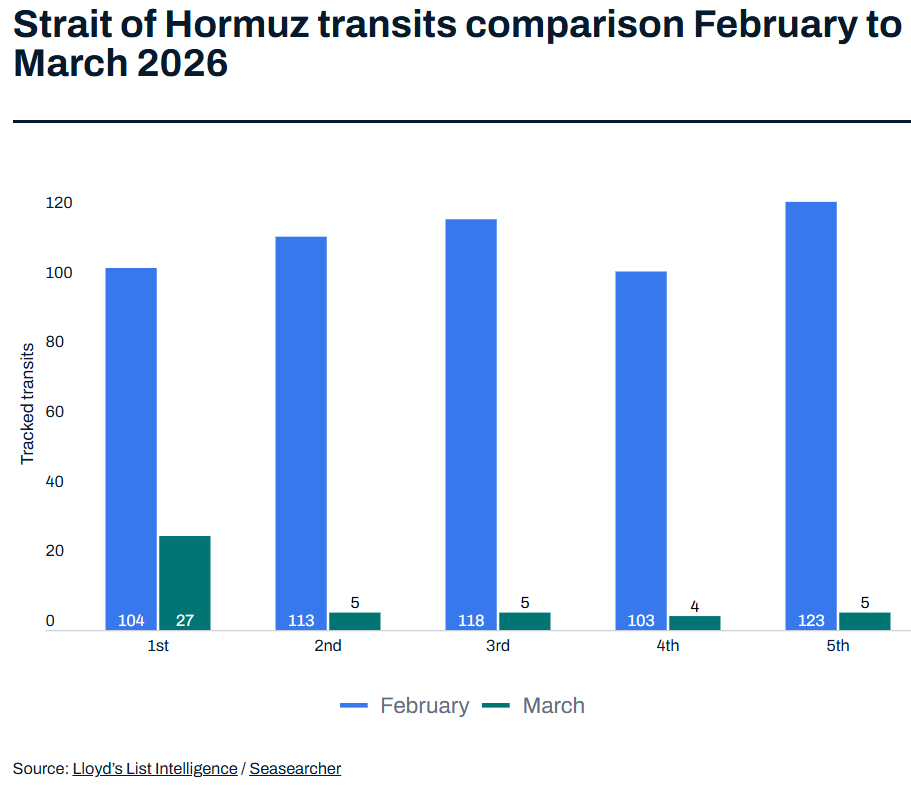
The first Chart shows ship traffic through the Strait of Hormuz, one of the most important energy arteries on the planet. In February 2026, daily transits ranged between roughly 100 and 123 large vessels. By the first week of March, that number collapsed to just four or five ships per day, effectively a shutdown.
That’s not a disruption. That’s a chokepoint going dark.
If the Strait remains closed for an extended period of time, the economic implications are obvious. Roughly a third of globally traded crude exports originate from producers that rely on the Strait, including Saudi Arabia, Iraq, Kuwait, and the United Arab Emirates. Meanwhile, Qatar sends about one-fifth of global LNG exports through the same corridor. When that artery tightens, energy prices move fast. Crude prices have already surged, and refined fuels: diesel, jet fuel, and LNG have jumped even faster.
For investors with a sense of economic history, the parallels with the 1973 Oil Embargo and the 1979 Oil Crisis are obvious. Those events triggered the stagflationary spiral that defined the decade: rising energy costs, falling real incomes, and central banks trapped between inflation and recession.
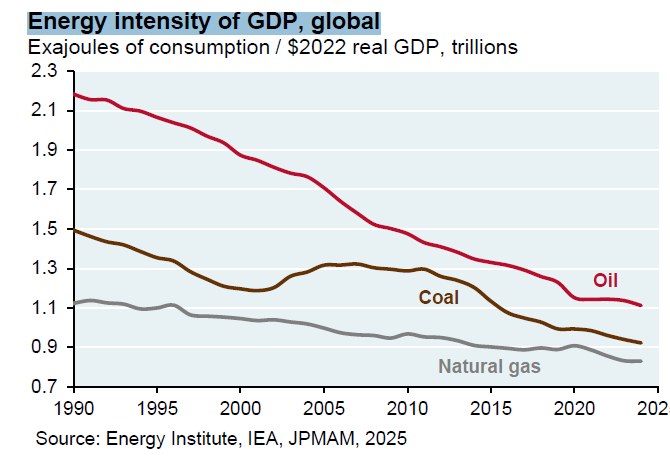
But the second Chart highlights a crucial difference between then and now.
Since 1990, the energy intensity of global GDP, the amount of energy required to produce a dollar of output, has fallen dramatically. Oil intensity alone has dropped by roughly half, while coal and natural gas show similar long-term declines. Decades of technological progress, efficiency improvements, and the shift toward service-based economies have fundamentally changed the relationship between energy consumption and economic growth.
In the 1970s, oil wasn’t just transportation fuel, it was embedded everywhere: industry, heating, electricity, chemicals, and manufacturing. When supply collapsed, economic output collapsed with it.
Today, the system has more resilience. Electric vehicles, more efficient aircraft, improved building standards, and digital services all reduce the oil-to-GDP link. That doesn’t mean an energy shock wouldn’t hurt. It simply means the direct economic damage is smaller than it once would have been.
The real risk, as always, lies somewhere else.
Repeated shocks: the pandemic, war-driven energy disruptions, supply chain fragmentation, and now geopolitical conflict all begin to change expectations. When households and businesses start assuming that inflation will remain high, behavior changes. Wages adjust, but not usually enough. Pricing adjusts. Policy becomes harder.
That’s the real ghost of the 1970s.
Not the oil itself, but the psychology that followed.
Sources: Energy Institute Statistical Review of World Energy; Lloyd’s List/Seasearcher
🚙 Interesting Drive-By's 🚙
🎯 Dr. Tokens or: How I Learned to Stop Worrying and Love the AI Bubble
💡 Power in the Age of Intelligence
🚀 Why Are Startups Growing Faster Than Ever Before?
👋🏼 Parting Thought
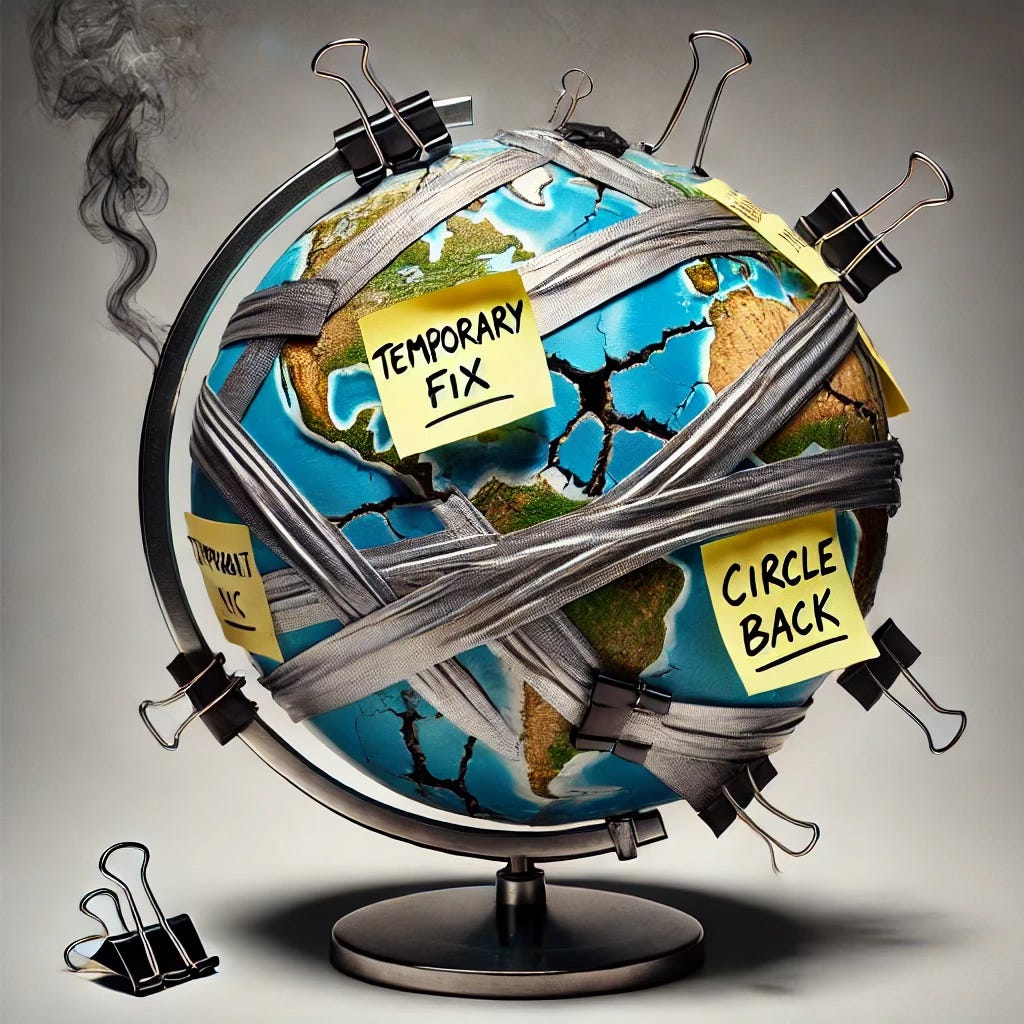
Does anyone else feel like the world is being held together these days with duct tape and chewing gum?
If you have any cool articles or ideas that might be interesting for future Sunday Drive-by's, please send them along or tweet 'em (X ‘em?) at me.
Please note that the content in The Sunday Drive is intended for informational purposes only, and is in no way intended to be financial, legal, tax, marital, or even cooking advice. Consult your own professionals as needed. The views expressed in The Sunday Drive are mine alone, and are not necessarily the views of Investment Research Partners.
I hope you have a relaxing weekend and a great week ahead. See you next Sunday...
Your faithful financial provocateur,
-Mike
If you enjoy the Sunday Drive, I'd be honored if you'd share it with others.
If this was forwarded to you, please subscribe and join the other geniuses who are reading this newsletter.