


The Sunday Drive - 01/26/2025 Edition [#147]
Musings and Meanderings of a Financial Provocateur

👋🏼 Hello friends! Let's enjoy a leisurely Sunday Drive around the internet.
🎶 Vibin'
This Polar Vortex has GOT TO GO! (h/t to Chris Rock)… When Pensacola, FL gets six inches of snow, it’s time to re-think what winter is all about.
So this week, I’m vibin’ to The Coasters’ Down in Mexico and thinking warm thoughts.
💭 Quote of the Week
“We have to invest in the world we live in, and not the world we want.“
— Charlie Munger
📈 Charts of the Week

The first Chart this week shows the performance of NVIDIA (NYSE: NVDA) over the last few years. In particular, the run the stock has had since early 2023 has been breathtaking.
The AI boom, sparked by advancements like ChatGPT, created an unprecedented demand for NVIDIA’s GPUs, cementing its position as the leader in AI hardware. The company’s dominance in this space is evident through its skyrocketing revenue and major financial milestones.
In fiscal year 2024, NVIDIA posted a staggering $60.9 billion in revenue, up 126% year-over-year. Its data center revenue alone grew 409% in Q4, and the company’s market cap crossed $3 trillion in 2024, placing it among the world’s top five most valuable companies.
Several market forces have shaped NVIDIA’s journey. The COVID-19 pandemic accelerated demand for gaming and AI-driven solutions, while cryptocurrency booms introduced periods of volatility. NVIDIA’s leadership in GPUs also positioned it as a critical supplier to major tech firms and supercomputing projects, reinforcing its dominance.
NVIDIA’s performance has largely been a function of innovation, market strategy, and timing—its ability to maintain this trajectory will depend on continued AI adoption and successful execution of its roadmap.
It’s been a pretty easy ride the last few years, but it hasn’t always been.
If you invested $1,000 in NVDA when the company went public in January of 1999, that investment would now be worth a whopping $5.7mm today. Holy cow! 📈
But wait… What level of volatility would an investor have had to endure in order to earn that epic level of return on their investment over the last 26 years?
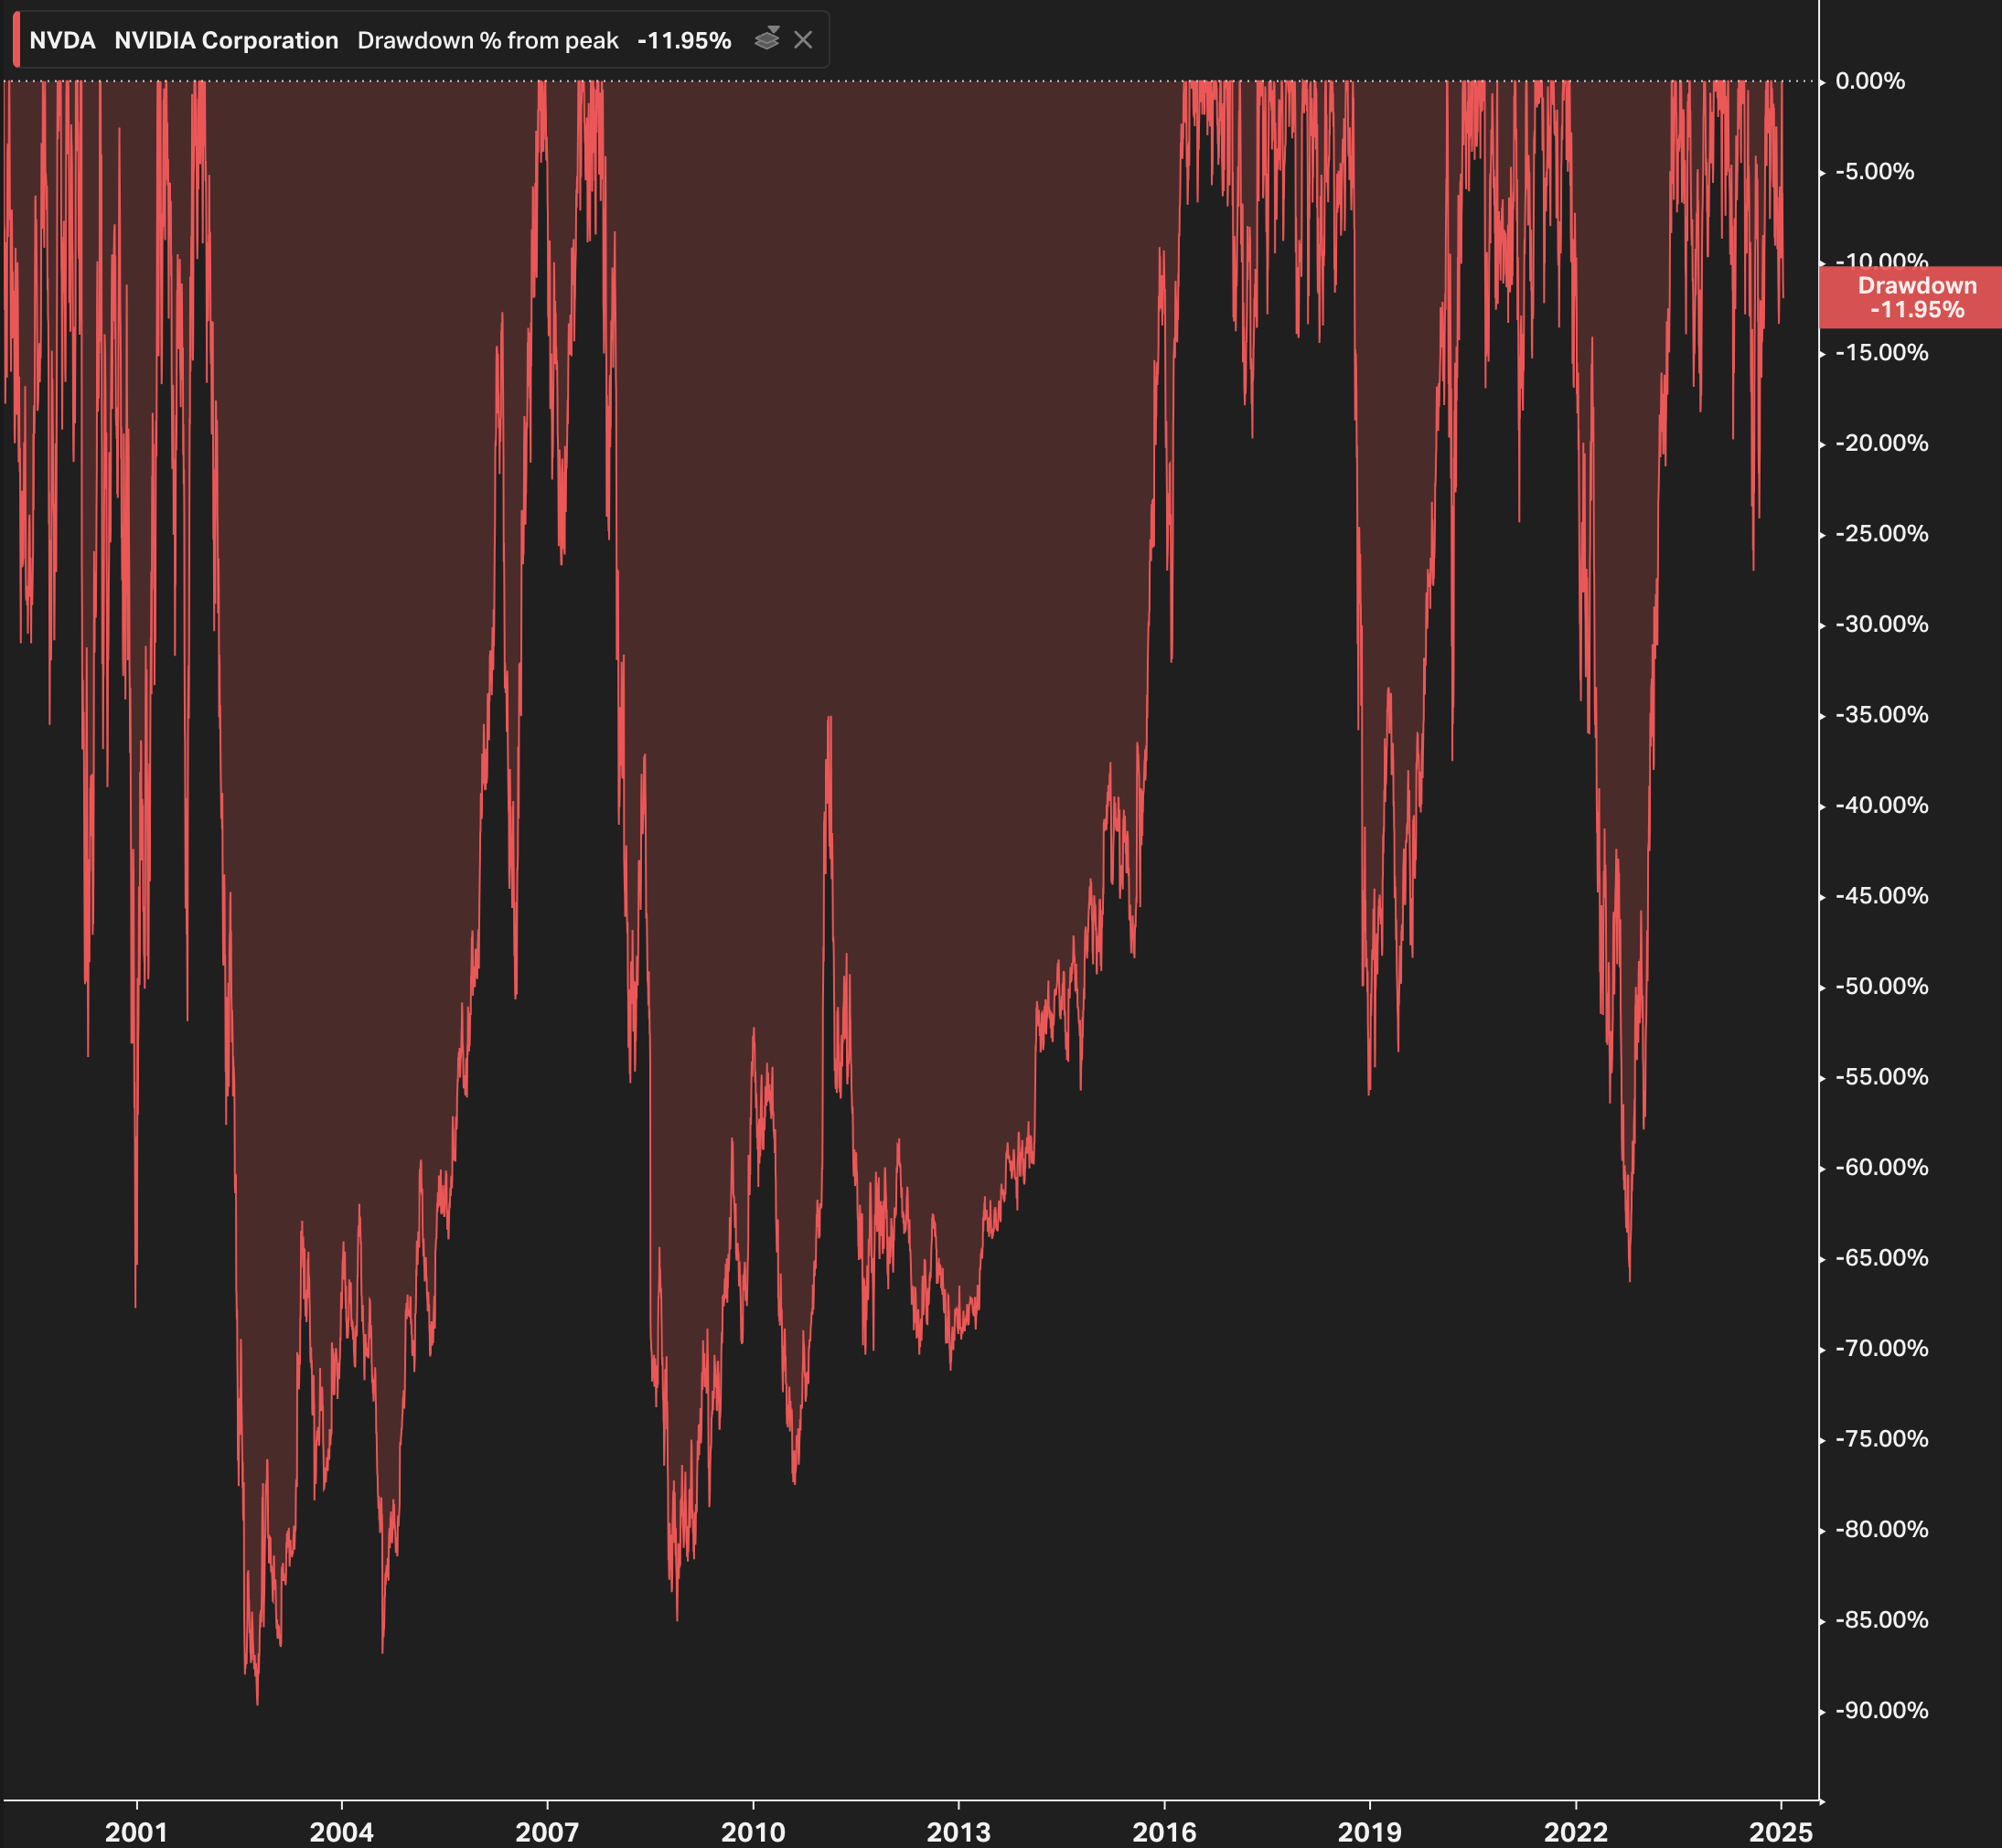
The second Chart this week shows the drawdowns in NVDA stock since its IPO. There’ve been quite a few of the 20%+ variety, but also multiple drops of greater than 80%. Some of those drawdowns lasted for years.
The relationship of risk and return, at least at the individual stock level, is widely understood and investors are often told about the importance of staying invested. But… Sometimes that’s easier said than done.
Sources:
1. Investing.com
2. LibertyRPF.com
3. YCharts
🚙 Interesting Drive-By's
📉 Out of Sight, Out of Loan: Hidden Leverage
💡 You Need to be Wholesome-Maxxing
💸 The $84 Trillion Wealth Transfer is a Fantasy
🤓 AI Demand Leads to “GPU-as-a-Service” Industry
🤔 Can We Actually Build Stargate?
👋🏼 Parting Thought

If you have any cool articles or ideas that might be interesting for future Sunday Drive-by's, please send them along or tweet 'em (X ‘em?) at me.
Please note that the content in The Sunday Drive is intended for informational purposes only, and is in no way intended to be financial, legal, tax, marital, or even cooking advice. Consult your own professionals as needed. The views expressed in The Sunday Drive are mine alone, and are not necessarily the views of Investment Research Partners.
I hope you have a relaxing weekend and a great week ahead. See you next Sunday...
Your faithful financial provocateur,
-Mike
If you enjoy the Sunday Drive, I'd be honored if you'd share it with others.
If this was forwarded to you, please subscribe and join the other geniuses who are reading this newsletter.